


A month ago I received a 3-month scholarship from DataQuest. Most people are familiar with DataCamp learning platform, but not so much with DataQuest.
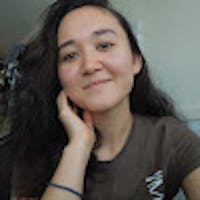
Data Science Path interface
DataQuest has 4 different paths: Data Analyst, Data Scientist and Data Engineer (all in Python), and lastly Data Analyst in R. Data Analyst and Data Scientist paths in Python share a lot of similar courses with the latter having some more additional content on Machine Learning and Data Structures.
Currently I am on Data Scientist path, which has 8 steps overall. Each steps consists of anywhere between 3 to 6 courses, and each course, in turn, has 4 to 8 missions. Each course allows the user to work on a ‘Guide Project’, meaning it gives you instructions on how to complete your projects. However, there is some liberty in adding steps that you think makes sense.
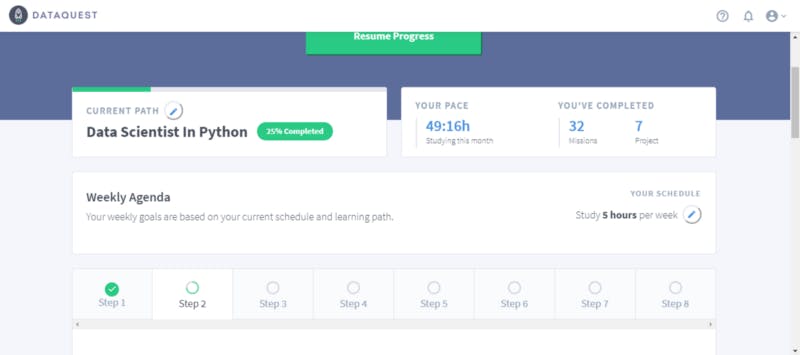
A guided project on 2 datasets to practice cleaning and analyzing data
DataQuest interface reminds me what Codecademy used to be, but with more complicated lessons obviously. It doesn’t just teach you concepts on their own, but rather lets your apply your skills to some chosen dataset for that particular mission. For instance, I have worked with Hacker News dataset, Happiness Index datasets for 2015, 2016 and 2017 years, etc. So you are not just learning pandas, but you are mastering it while applying it to a sample dataset.
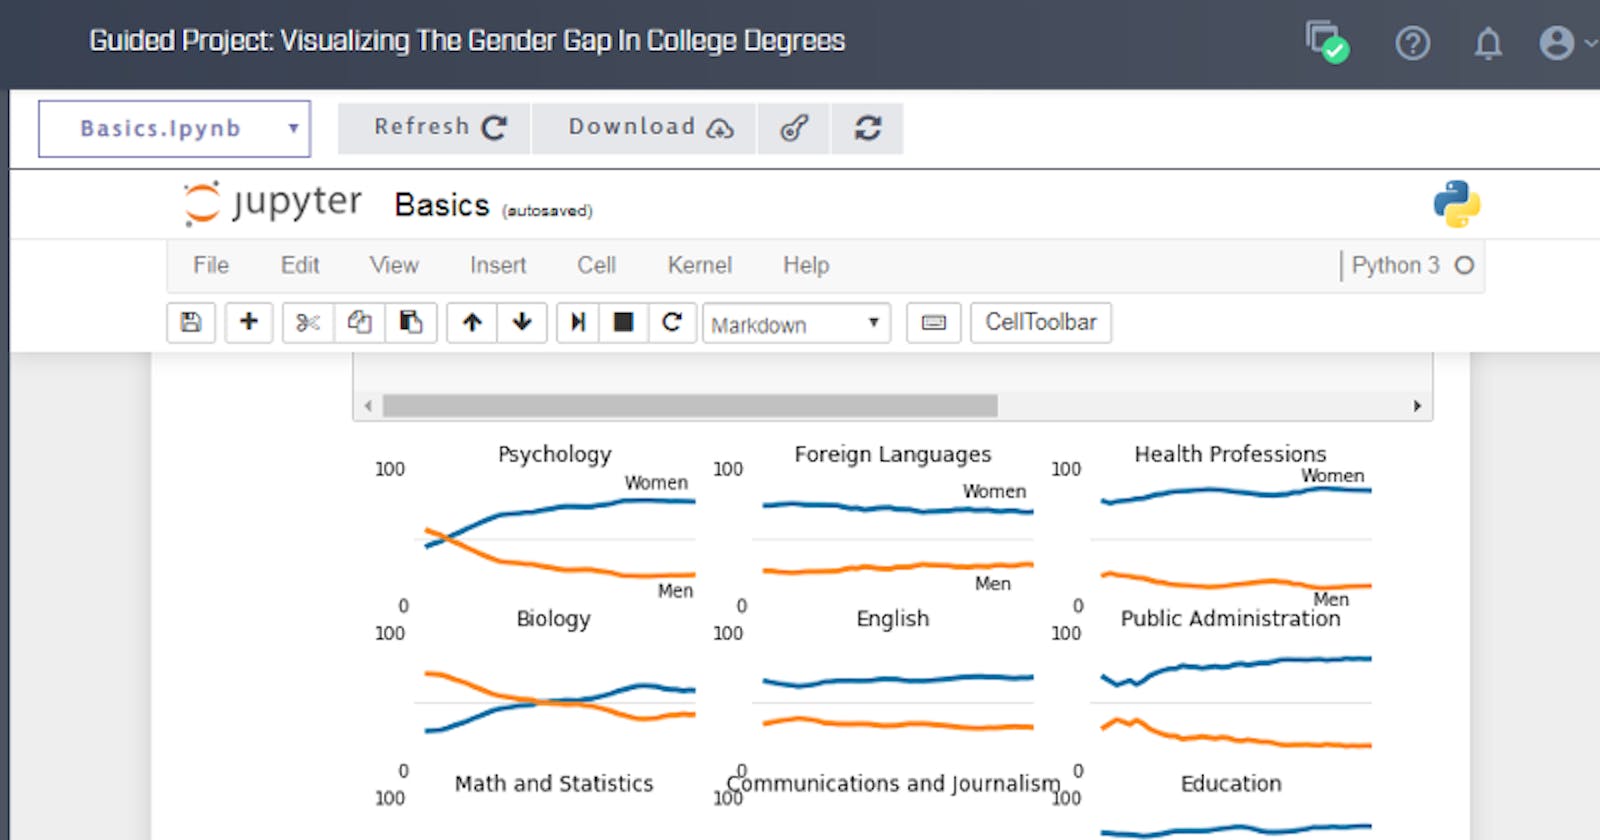
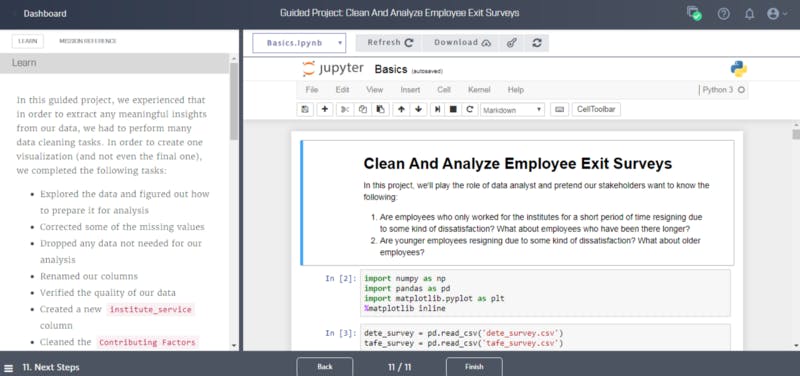
Mind you, it has its own Statistics class toward the middle of the path. Having taken Intro to Statistics class in school, I have my fears squashed a bit. Quite frankly, I have thoroughly enjoy Statistics now so I am looking forward to that part on my path. My favorite part so far has been Visualization courses. I got to learn and practice pandas built-in visualization tools, as well as matplotlib and seaborn. This part especially inspired me to seek an outside dataset, formulate questions independently and make interesting visualizations like below. In fact, VizforSocialGood (look them up) runs contests for the best visualization for a given international non-profit organization. Dataset and interesting ensuing questions are always provided.
Gender Gap in College Degrees viz
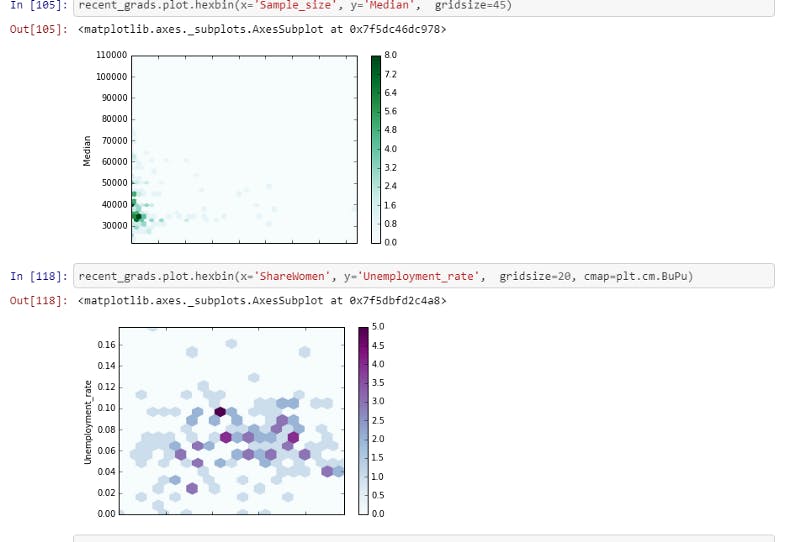
Exploring hexagonal plots on my own
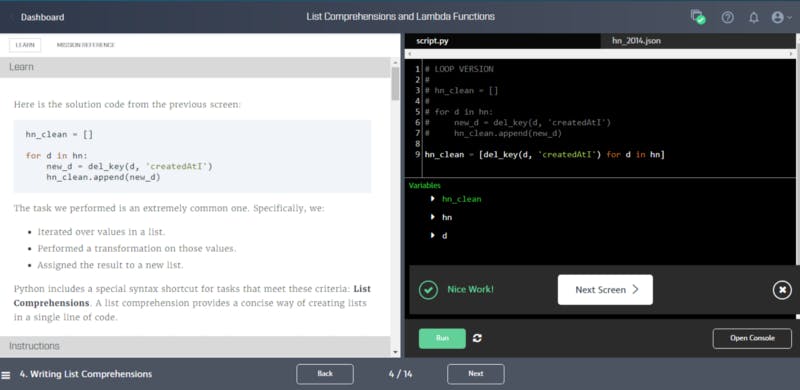
DataQuest started its scholarship program only recently. I believe they run it twice a year. Keep yourself updated and subscribe to their newsletter, as you will get so much more valuable information as well. For now, I will get back to studying List Comprehensions and Lambda Functions, because that’s where I am at.
Connect with me on LinkedIn.